










Nowadays data is everywhere. Companies track customer behavior, sales performance, operational efficiency, financial trends, employee productivity, and market growth in real time. But collecting data is no longer enough. Organizations now need professionals who can turn raw information into meaningful business decisions.
For years, Microsoft Excel was the primary tool analysts relied on for reporting and data management. It still plays a critical role in many organizations today. However, as businesses become more data-driven, Excel alone can no longer meet the growing demand for scalable analytics, automation, collaboration, and interactive reporting.
This is Where Power BI and the PL-300 Certification Enter the Picture
The transition from Excel spreadsheets to intelligent business analytics platforms represents one of the biggest career shifts for modern analysts. Professionals who once focused on formulas and static reports are now expected to create interactive dashboards, automate insights, connect multiple data sources, and help leadership teams make faster decisions with confidence.
We have seen firsthand how organizations are transforming their reporting culture by moving from manual spreadsheet operations toward modern business intelligence ecosystems. The PL-300 certification has become a valuable stepping stone for analysts who want to stay competitive in this evolving landscape.
As the saying goes:
“Excel helped businesses organize data. Power BI helps businesses understand it.”
This guide explores the complete roadmap for transitioning from Excel to Power BI while preparing for the PL-300 certification in a practical, realistic, and career-focused way.
Why Traditional Excel Reporting Is No Longer Enough
Excel remains one of the most powerful productivity tools ever created. It is flexible, accessible, and familiar to millions of professionals worldwide. But modern business environments are becoming increasingly complex, and spreadsheets often struggle to keep up with the speed and scale of today’s data requirements.
Many analysts spend hours every week fixing broken formulas, updating disconnected reports, consolidating files from multiple departments, and manually refreshing outdated dashboards. Over time, this creates inefficiencies that affect decision-making across the organization.
One of the biggest problems with spreadsheet-driven reporting is fragmentation. Different departments often maintain separate versions of the same data. Finance has one report, operations has another, and leadership receives conflicting numbers depending on which spreadsheet is being referenced.
The hidden cost of spreadsheet culture is not just operational delay. It is reduced trust in data.
Businesses today need:
- Real-time visibility
- Automated reporting
- Centralized data sources
- Interactive dashboards
- Scalable analytics
- Secure collaboration environments
Power BI addresses these challenges by transforming static reporting into dynamic business intelligence.
Instead of emailing spreadsheets back and forth, organizations can create live dashboards that update automatically and provide instant visibility into KPIs, operational metrics, and business trends.
For analysts, this shift changes the role entirely. The focus moves away from maintaining reports and toward delivering actionable insights.
Understanding the PL-300 Certification
The PL-300 certification, officially known as the Microsoft Certified: Power BI Data Analyst Associate certification, validates a professional’s ability to prepare, model, visualize, and analyze data using Power BI.
In simple terms, the certification proves that an analyst understands how to turn data into business intelligence.
The PL-300 exam focuses on several core areas:
- Data preparation
- Data transformation
- Data modeling
- DAX calculations
- Dashboard development
- Report optimization
- Data visualization
- Security implementation
- Business insight generation
Organizations increasingly value PL-300 certified professionals because they demonstrate both technical understanding and analytical thinking.
Modern companies no longer want analysts who simply generate reports. They want professionals who can:
- Identify trends
- Simplify complex information
- Support strategic decisions
- Improve operational visibility
- Build scalable reporting environments
This growing demand is also why businesses frequently collaborate with experienced Microsoft business intelligence consultants to design enterprise-grade analytics ecosystems that align with long-term operational goals.
What Skills Does PL-300 Measure?
The certification evaluates practical analytical skills rather than theoretical memorization. Candidates are expected to:
- Connect multiple data sources
- Clean and transform datasets
- Build efficient data models
- Create meaningful visualizations
- Develop DAX measures
- Implement row-level security
- Optimize report performance
Who Should Take the PL-300 Exam?
The PL-300 certification is ideal for:
- Excel analysts
- Reporting specialists
- Business analysts
- Financial analysts
- Data professionals
- Operations analysts
- BI developers
- Power BI beginners transitioning into analytics careers
Even professionals with limited technical backgrounds can successfully prepare for the exam with consistent practice and hands-on learning.
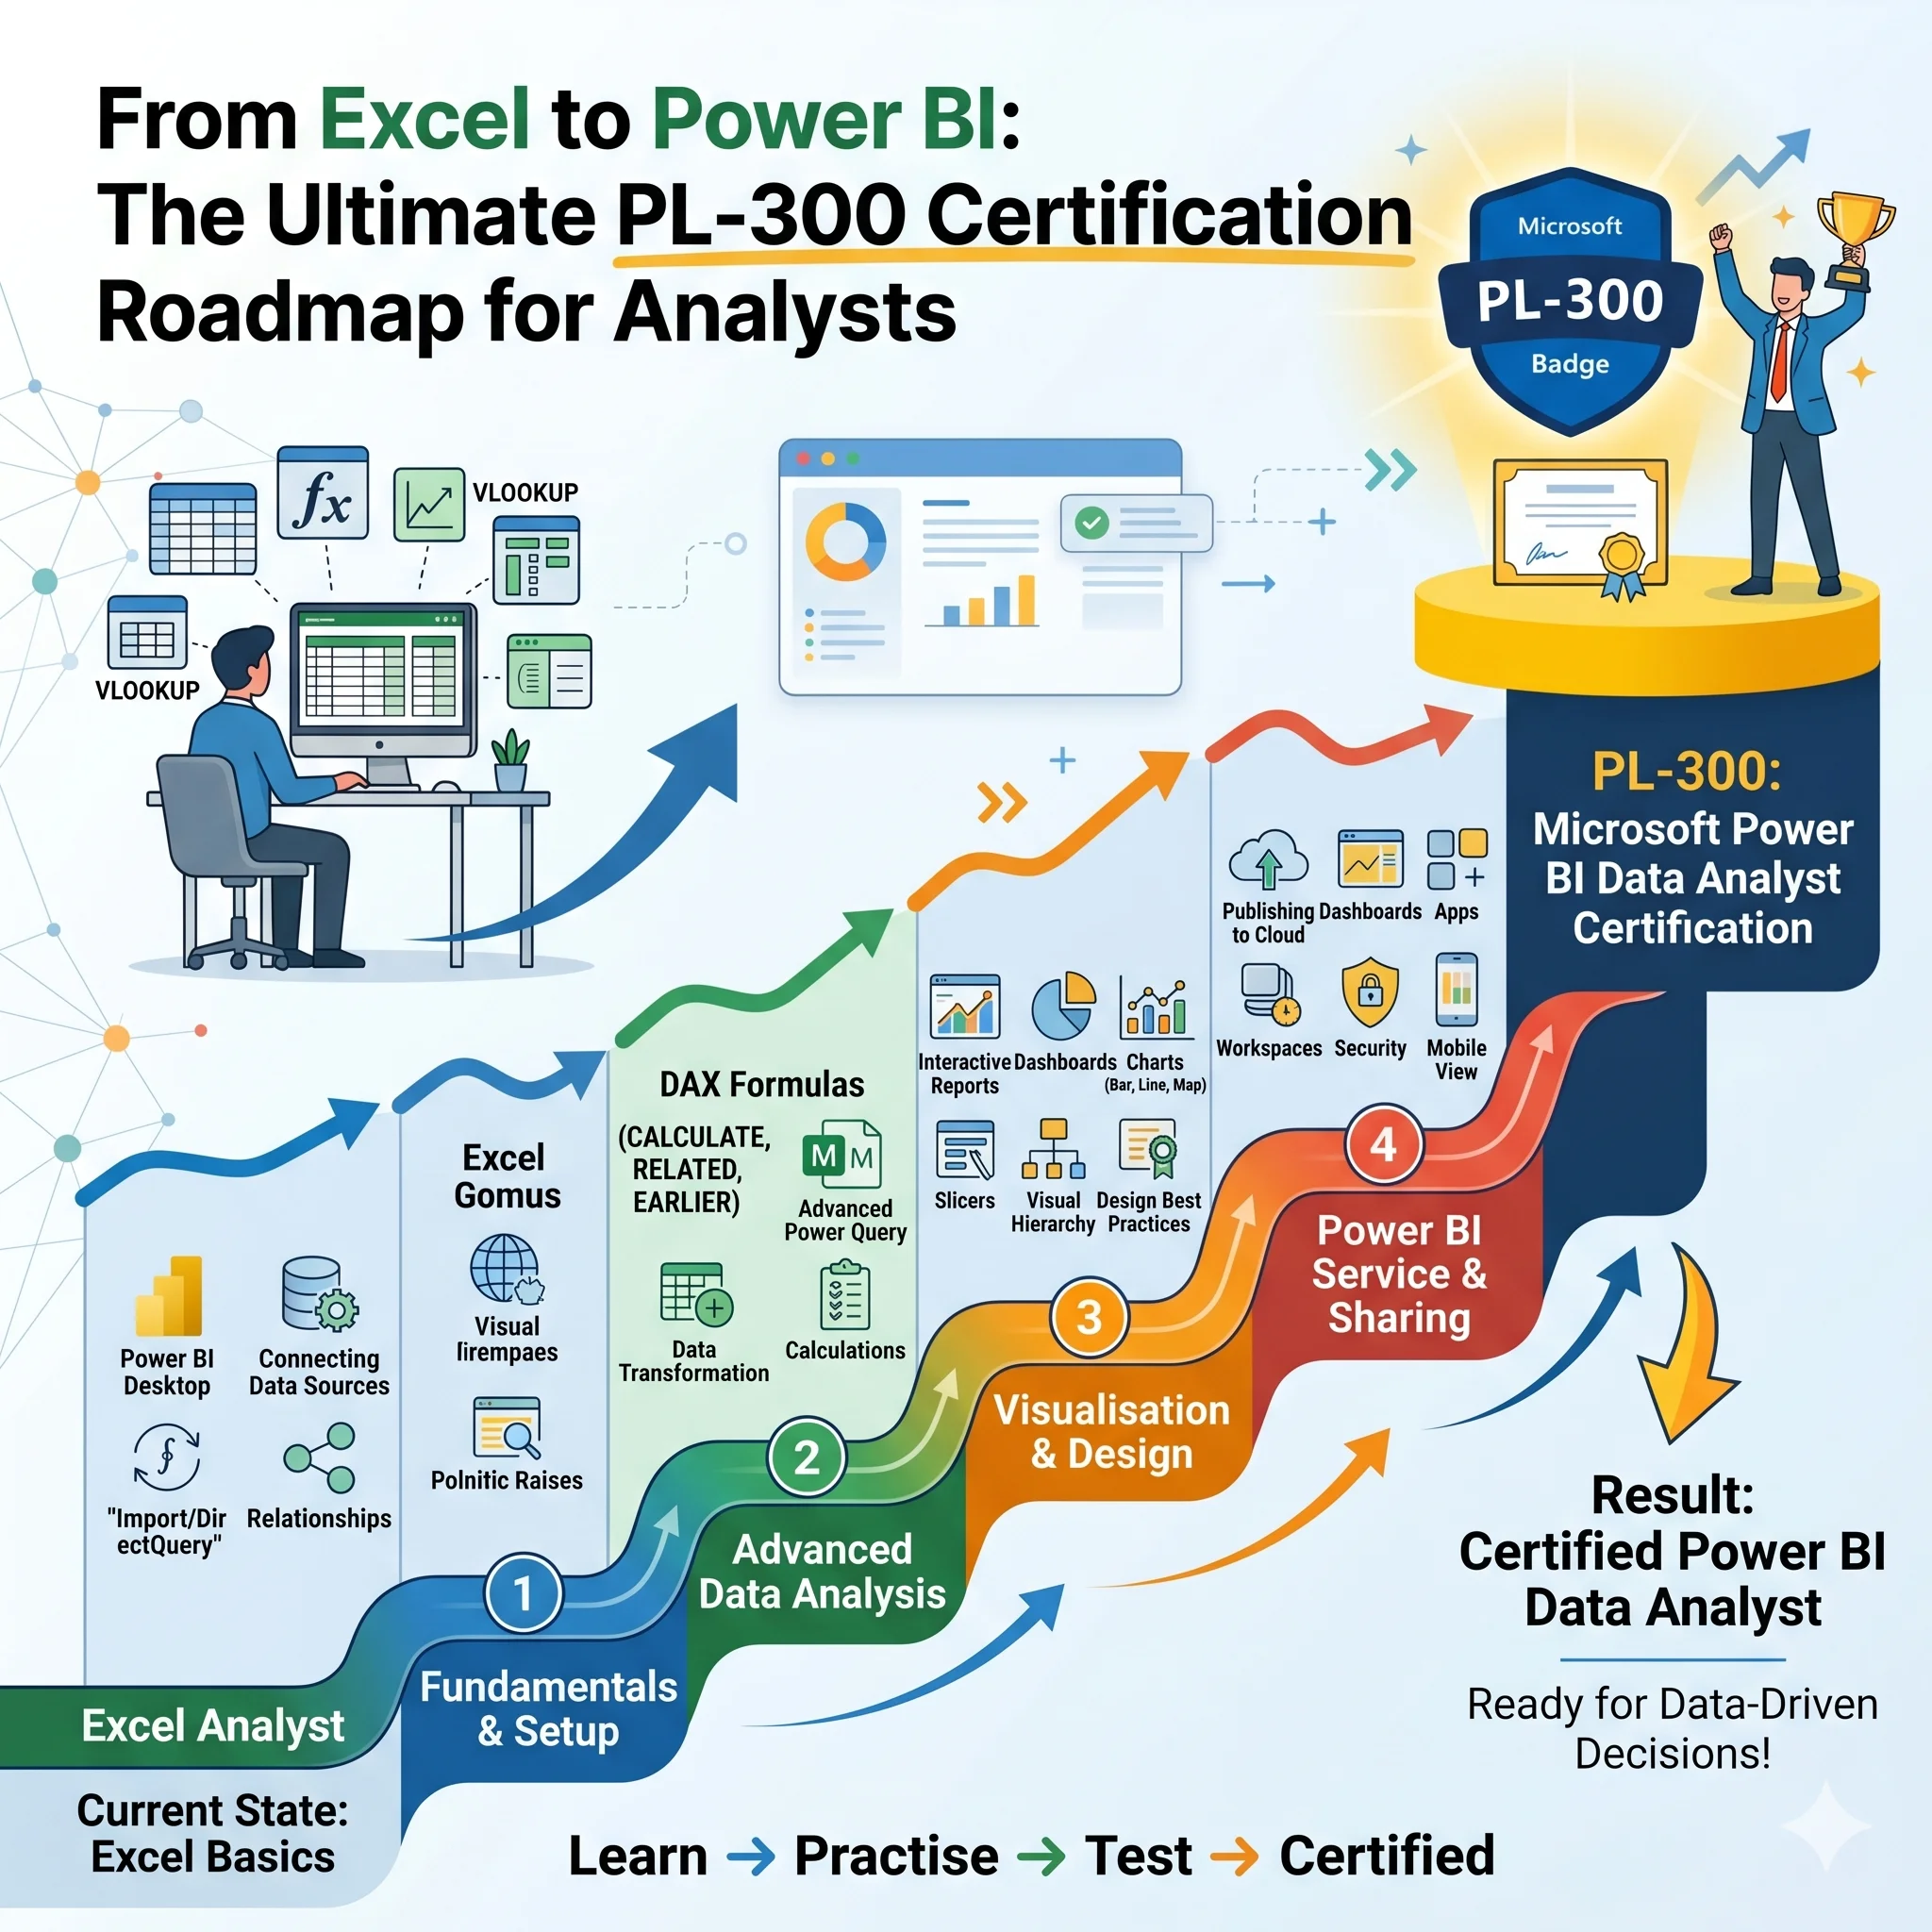
The Complete Roadmap from Excel User to Power BI Analyst
Transitioning from Excel to Power BI is not about abandoning spreadsheets completely. It is about expanding analytical capabilities.
The journey becomes easier when approached step by step.
Step 1 — Build Strong Data Foundations
Before creating dashboards, analysts must understand how data works structurally.
This includes:
- Tables and relationships
- Data normalization
- Data types
- Structured datasets
- Clean data practices
One common mistake beginner make is focusing too heavily on visual design before understanding data architecture.
Analysts who understand data modeling progress much faster than analysts who only focus on charts.
Another important shift involves understanding the difference between Excel formulas and DAX logic. While Excel calculations typically operate cell by cell, Power BI calculations often work within broader filter and relationship contexts.
This conceptual shift is one of the most important milestones in becoming a strong Power BI analyst.
Step 2 — Learn Power Query and Data Transformation
Power Query is one of the most valuable skills within Power BI.
Real-world business data is rarely clean. Analysts constantly deal with:
- Duplicate records
- Missing values
- Inconsistent formatting
- Disconnected systems
- Multiple file types
Power Query helps automate these cleanup processes.
Instead of manually fixing spreadsheets every week, analysts can create repeatable transformation workflows that update automatically.
Organizations also frequently combine reporting environments with Power automate consulting services to reduce repetitive operational tasks and improve workflow efficiency across departments.
Learning Power Query teaches analysts how to:
- Import data from multiple systems
- Transform raw information
- Merge datasets
- Standardize reporting
- Automate recurring processes
This dramatically reduces reporting time while improving data consistency.
Step 3 — Master Data Modeling
Great dashboards begin long before visualization starts.
Data modeling is the backbone of Power BI performance.
Analysts must understand:
- Fact tables
- Dimension tables
- Star schema architecture
- Relationship management
- Performance optimization
Poor data models create slow dashboards, broken filters, and inaccurate reports.
Strong data models create scalable, efficient analytics systems that support business growth.
Many beginners underestimate the importance of this stage because visual dashboards receive the most attention. But experienced analysts know that dashboard quality depends heavily on backend structure.
Step 4 — Learn DAX Without Fear
DAX (Data Analysis Expressions) is often the most intimidating part of Power BI for beginners.
But the fear usually comes from trying to memorize formulas instead of understanding logic.
DAX allows analysts to create:
- KPIs
- Dynamic calculations
- Time intelligence metrics
- Performance comparisons
- Business ratios
- Rolling averages
The key is starting simple.
Instead of jumping into advanced calculations immediately, analysts should focus first on:
- SUM
- CALCULATE
- IF
- DIVIDE
- FILTER
- DATE functions
Over time, DAX becomes less about syntax and more about analytical thinking.
Why DAX Feels Difficult at First — and How to Overcome It
Unlike Excel, DAX works within data relationships and filter contexts. This requires a different way of thinking.
The best way to improve is through repetition and real business scenarios rather than memorization alone.
Step 5 — Build Interactive Dashboards
Visualization is where business intelligence becomes visible to decision-makers.
But effective dashboards are not simply colorful charts.
Strong Power BI dashboards:
- Tell stories clearly
- Highlight business priorities
- Simplify complexity
- Focus attention on KPIs
- Improve decision-making speed
Analysts should learn dashboard UX principles such as:
- Layout consistency
- Proper spacing
- Visual hierarchy
- Interactive filtering
- Mobile responsiveness
Power BI is widely used across:
- Finance analytics
- Retail reporting
- HR dashboards
- Sales tracking
- Operational monitoring
- Executive reporting
The best dashboards reduce noise and increase clarity.
What Most PL-300 Candidates Get Wrong
One of the biggest mistakes candidates make is studying the certification as if it were purely theoretical.
Power BI is a practical platform. The exam tests real analytical thinking.
Many candidates:
- Memorize terminology
- Focus only on visuals
- Ignore business scenarios
- Avoid DAX practice
- Skip data modeling concepts
As a result, they may understand features individually but struggle to solve real business problems.
Certification Knowledge vs Real Business Intelligence
Passing the PL-300 exam is valuable, but real-world analytics requires more than certification alone.
Successful analysts learn how to:
- Ask better business questions
- Understand stakeholder needs
- Interpret operational problems
- Translate business goals into dashboards
Why Context Matters in Data Analysis
A beautiful report means very little if it does not support business decisions.
Strong analysts understand both data and business context simultaneously.
This combination is what separates dashboard builders from strategic analysts.
Real-World Power BI Skills That Matter Beyond Certification
In enterprise environments, technical skills alone are not enough.
Analysts also need:
- Communication skills
- Business understanding
- Data governance awareness
- KPI alignment knowledge
- Security implementation experience
One of the most valuable skills is stakeholder communication.
Analysts must learn how to speak both “business language” and “data language.”
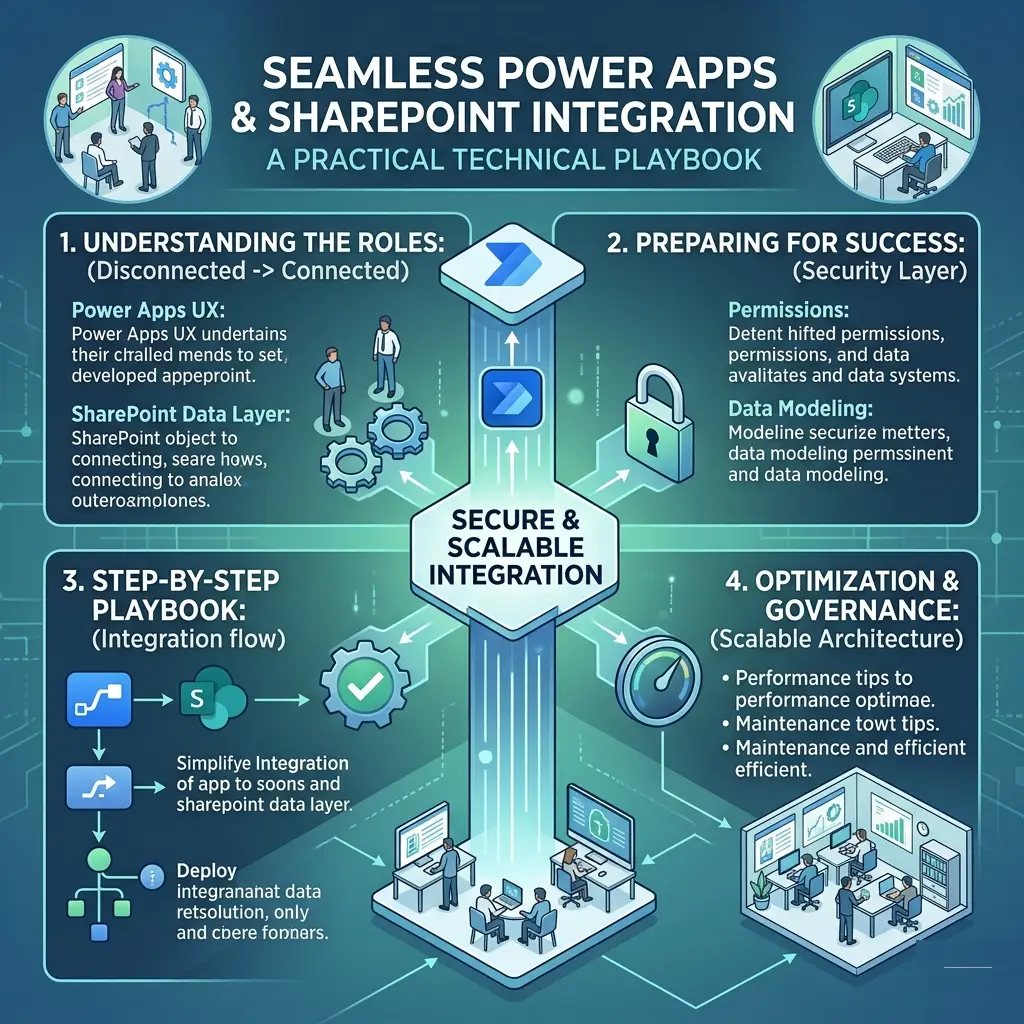
Businesses increasingly connect Power BI environments with operational systems through Microsoft PowerApps integration services to create unified decision-making ecosystems that combine analytics, workflows, and operational execution.
Analytics is no longer isolated from business operations. It is becoming deeply integrated into broader digital transformation strategies.
Modern analysts must therefore understand:
- Cross-functional reporting
- Workflow integration
- Data security
- Performance optimization
- User adoption strategies
These capabilities make analysts far more valuable inside enterprise organizations.
The Growing Role of the Microsoft Power Platform Ecosystem
Power BI no longer operates as a standalone reporting tool.
It is now part of the larger Microsoft Power Platform ecosystem, which includes:
- Power BI
- Power Apps
- Power Automate
- Dataverse
Together, these technologies allow businesses to build complete low-code digital ecosystems.
For example:
- Power BI analyzes business data
- Power Apps captures operational inputs
- Power Automate manages workflows
- Dataverse centralizes information
Many enterprises now invest in broader Power platform services to unify reporting, automation, collaboration, and application development within one connected ecosystem.
Why Power BI Is No Longer a Standalone Tool
The future of analytics is integration.
Businesses increasingly want systems that:
- Share data automatically
- Trigger workflows instantly
- Support mobile operations
- Reduce manual effort
- Improve operational visibility
Analysts who understand the broader Power Platform ecosystem gain a major competitive advantage in the job market.
Career Opportunities After PL-300 Certification
The demand for Power BI professionals continues to grow across industries worldwide.
After earning PL-300 certification, professionals may pursue roles such as:
- Data Analyst
- BI Developer
- Reporting Specialist
- Analytics Engineer
- Power BI Consultant
- Functional Analyst
One of the biggest advantages of Power BI is its versatility. Nearly every industry relies on analytics today, including:
- Healthcare
- Retail
- Manufacturing
- Finance
- Logistics
- Education
- Government
- Technology
The certification also opens opportunities for:
- Remote work
- Freelancing
- Consulting
- Enterprise analytics careers
Organizations modernizing secure digital environments may also collaborate with a microsoft intune consultant to ensure secure access management for enterprise reporting systems and mobile analytics platforms.
As companies continue adopting cloud technologies and modern analytics ecosystems, the demand for skilled Power BI professionals is expected to remain strong for years to come.
How SlickWhiz Solutions Supports Data-Driven Growth
At SlickWhiz Solutions, we believe analytics should simplify decisions—not complicate them.
Our approach focuses on helping organizations modernize their reporting environments through scalable business intelligence strategies, interactive dashboards, workflow automation, and data-driven operational visibility.
We support businesses through:
- Power BI implementation
- Dashboard development
- Reporting optimization
- Data transformation
- Analytics consulting
- Business intelligence modernization
- Power Platform strategy
Our goal is not simply to create dashboards. It is to help organizations build reporting ecosystems that improve visibility, increase efficiency, and support smarter decisions across every department.
Conclusion
The transition from Excel to Power BI represents far more than a software upgrade. It reflects a major shift in how businesses think about data, reporting, and decision-making.
The PL-300 certification provides analysts with a clear roadmap into the world of modern business intelligence. But success ultimately comes from combining technical skills with analytical thinking, business understanding, and continuous learning.
The most effective analysts are not the ones who create the most reports. They are the ones who create the clearest insights.
As organizations continue moving toward real-time analytics, automation, and integrated business intelligence ecosystems, the demand for skilled Power BI professionals will only continue to grow.
For analysts willing to evolve beyond spreadsheets, the future offers enormous opportunity.
And for businesses embracing data-driven transformation, the combination of Power BI, automation, and modern analytics may become one of their strongest competitive advantages.